Creating a bar chart component with SVG and Javascript

Generating charts with SVG and Vanilla JS
Recently, I used a React charts library named RECHARTS for different projects. I liked it very much because it makes it easy to have nice charts, however, I was wondering if I would be able to create a chart myself without any library.
Originally, I was going to use this as an opportunity to learn HTML canvas, but after reading some literature on the subject, I went with SVG instead.
So today I'll explain to you:
- What SVG is.
- The basics of creating the chart elements with SVG
- How I created my "bar chart generator" using only SVG and vanilla JS.
A link to a codesandbox environment with all the code discussed here is available at the end of this blog post.
What is SVG?
Let's see what MDN webdoc has to say:
Scalable Vector Graphics (SVG) are an XML-based markup language for describing two-dimensional based vector graphics.
As such, it's a text-based, open Web standard for describing images that can be rendered cleanly at any size and are designed specifically to work well with other web standards including CSS, DOM, JavaScript, and SMIL. SVG is, essentially, to graphics what HTML is to text.
SVG images and their related behaviors are defined in XML text files, which means they can be searched, indexed, scripted, and compressed. Additionally, this means they can be created and edited with any text editor or with drawing software.
Compared to classic bitmapped image formats such as JPEG or PNG, SVG-format vector images can be rendered at any size without loss of quality and can be easily localized by updating the text within them, without the need of a graphical editor to do so. With proper libraries, SVG files can even be localized on-the-fly.
In other (similar) words, SVG will describe shapes which will render perfectly, whatever the size of the display. They do not describe pixels, instead they define paths describing the shape and position of elements related to the svg "grid".
So the graphical element can ALWAYS be rendered with high quality, doesn't have to be stretched resulting in a blurred image, because pixels are actually generated taking into account the resolution of the display device.
So it seemed like a good tool to start building dynamically generated data charts!
I'm not going to list all the details about this format here , but if you want to know more about SVG, visit this link: https://deliciousbrains.com/svg-advantages-developers/#what-is-svg
A simple static chart with SVG
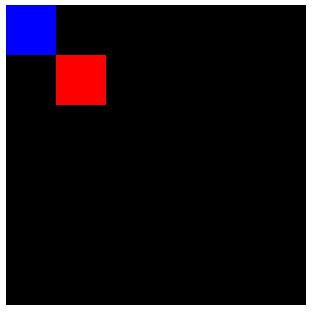
Okay now, look at this very simple svg example I made:
// Creating the SVG image, giving it a 300*300 grid.
<svg height='300' width='300'>
            //Creating a rectangle the size of the grid. Since nothing else is specified,
            //it will be black and positioned @ the origin point
            //(Top left equals (0, 0), bottom right will be (300,300)
            <rect height ='300' width ='300'/>
            //Then we draw the blue rectangle
            // (No position specified, so it will be @ the point of origin.
            <rect height ='50' width = '50' fill = 'blue'/>
            //Finally we draw the blue rectangle with and explicit position.
            <rect height ='50' width = '50' x = '50' y = '50' fill = "red"/>
        </svg>
In SVG, we can render different types of graphical elements, and the rectangle is one of them. It is pretty much the only shape we will need to create this barchart. This will render this image:
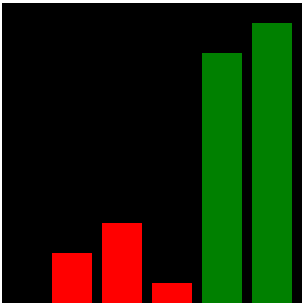
Now, if I want to make this look like a bar chart, I would do this:
    <svg height='300' width='300'>
                <rect height ='300' width ='300'/>
                <rect height ='50' width = '40' x = '50' y = '250' fill = 'red'/>
                <rect height ='130' width = '40' x = '100' y = '220' fill = "red"/>
                <rect height ='20' width = '40' x = '150' y = '280' fill = "red"/>
                <rect height ='250' width = '40' x = '200' y = '50' fill = "green"/>
                <rect height ='280' width = '40' x = '250' y = '20' fill = "green"/>
     </svg>
And it will render this:
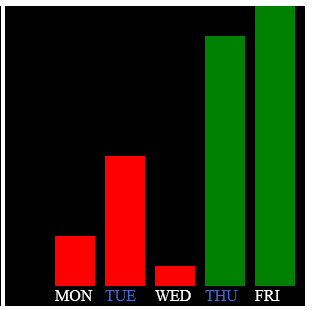
Now, let us move the bars up a little bit, and add some labels in the area we just freed:
<svg height='300' width='300'>
                <rect height ='300' width ='300'/>
                <rect height ='50' width = '40' x = '50' y = '230' fill = 'red'/>
                <rect height ='130' width = '40' x = '100' y = '150' fill = "red"/>
                <rect height ='20' width = '40' x = '150' y = '260' fill = "red"/>
                <rect height ='250' width = '40' x = '200' y = '30' fill = "green"/>
                <rect height ='280' width = '40' x = '250' y = '0' fill = "green"/>

                <text height ='50' width = '40' x = '50' y = '295' fill = 'white'>MON</text>
                <text height ='50' width = '40' x = '100' y = '295' fill = 'royalblue'>TUE</text>
                <text height ='50' width = '40' x = '150' y = '295' fill = 'white'>WED</text>
                <text height ='50' width = '40' x = '200' y = '295' fill = 'royalblue'>THU</text>
                <text height ='50' width = '40' x = '250' y = '295' fill = 'white'>FRI</text>
</svg>
It does look like a bar chart, doesn't it? :)
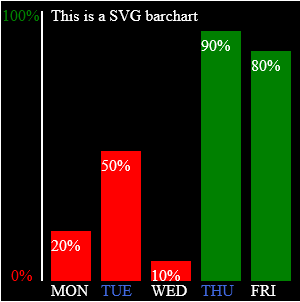
Now let us add a simple Y scale, some info inside the bars, and a title for our chart:
    <svg height='300' width='300'>
                <rect height ='300' width ='300'/>
                <rect height ='50' width = '40' x = '50' y = '230' fill = 'red'/>
                <rect height ='130' width = '40' x = '100' y = '150' fill = "red"/>
                <rect height ='20' width = '40' x = '150' y = '260' fill = "red"/>
                <rect height ='250' width = '40' x = '200' y = '30' fill = "green"/>
                <rect height ='230' width = '40' x = '250' y = '50' fill = "green"/>

                <text height ='50' width = '40' x = '50' y = '295' fill = 'white'>MON</text>
                <text height ='50' width = '40' x = '100' y = '295' fill = 'royalblue'>TUE</text>
                <text height ='50' width = '40' x = '150' y = '295' fill = 'white'>WED</text>
                <text height ='50' width = '40' x = '200' y = '295' fill = 'royalblue'>THU</text>
                <text height ='50' width = '40' x = '250' y = '295' fill = 'white'>FRI</text>

                <text height ='20' width = '40' x = '50' y = '250' fill = 'white'>20%</text>
                <text height ='20' width = '40' x = '100' y = '170' fill = 'white'>50%</text>
                <text height ='20' width = '40' x = '150' y = '280' fill = 'white'>10%</text>
                <text height ='20' width = '40' x = '200' y = '50' fill = 'white'>90%</text>
                <text height ='20' width = '40' x = '250' y = '70' fill = 'white'>80%</text>

                <rect x = '40'  y = '10' height='270' width = '2' fill= 'white'/>
                <text height ='20' width = '30' x = '1' y = '20' fill = green>100%</text>
                <text height ='20' width = '30' x = '10' y = '280' fill = 'red'>0%</text>

                <text height ='20' width = '100' x = '50' y = '20' fill = white>This is a SVG barchart</text>

        </svg>
aaaaaaand... there we go :)
Dynamically generate SVG elements with Javascript.
Now, what we will do, is create a set of functions able to generate a barchart from a dataset (Array of objects).
Let us look a the dataset:
export const dataForChart = [
  {
    label: "Simple",
    value: 40
  },
  {
    label: "chart",
    value: 100
  },
  {
    label: "using",
    value: 120
  },
  {
    label: "SVG",
    value: 140
  },
  {
    label: "and",
    value: 160
  },
  {
    label: "Vanilla",
    value: 200
  },
  {
    label: "JS",
    value: 350
  }
];
The first thing we want to do now, before inserting stuff in our SVG element, is to initialize it with Javascript. I've created a function to "automate" this task. We provide X and Y dimensions as parameters.
This is "business as usual": create an element, assign it some properties, then return it so other operations can be applied to the newly created element.
You can see, however that we use document.createElementNS instead of createElement, and we need to provide a link to the namespace we want to use. Now, I'm not going to bullshit you, I'm not sure what it means exactly, but trust me, this is the way it works :p
//Will create a new SVG element of the specified dimensions
const createSvg = (width, height) => {
  const svgPlayground = document.createElementNS(
    "http://www.w3.org/2000/svg",
    "svg"
  );
  svgPlayground.setAttribute("height", height);
  svgPlayground.setAttribute("width", width);
  svgPlayground.setAttribute("class", "svg");
  return svgPlayground;
};
Great, now, let's populate the SVG with bars generated using the above dataset.
First we create function to generate and append a bar element in a specified chart, at a specified position, with specified X and Y coordinates, and also to create a element to display the value above the bar.
//Will APPEND a bar in the specified container
const createBarInChart = (x, y, width, height, style, parent) => {
  // Adding Value Tag
  const valueTag = document.createElementNS(
    "http://www.w3.org/2000/svg",
    "text"
  );
  valueTag.setAttribute("x", x + width / 2);
  valueTag.setAttribute("y", y - 8);
  valueTag.append(height);
  valueTag.setAttribute("text-anchor", "middle");
  valueTag.setAttribute("class", "barValueLabel");
  parent.appendChild(valueTag);

  const bar = document.createElementNS("http://www.w3.org/2000/svg", "rect");
  bar.setAttribute("x", x);
  bar.setAttribute("y", y - 3);
  bar.setAttribute("rx", 3);
  bar.setAttribute("height", height);
  bar.setAttribute("width", width);
  bar.setAttribute("style", style);
  bar.setAttribute("class", "bar");
  parent.appendChild(bar);
};
Then, we create another function which will iterate over the data objects and happen a bar for each value in the dataset.
It will automatically size the bars based on the available space in the parent SVG element.
const generateDataBarsForChart = (chart, dataForChart) => {
  //First, lets calculate the width for each bar, based on the chart width
  const barWidth =
    (chart.width.baseVal.value * 0.8) / (dataForChart.length * 1.1);
  let currentX = barWidth / 5;
  dataForChart.forEach((element) => {
    //Let us find out where we should originate the bar vertically
    // so they display at the bottom instead of the top.
    const currentY = chart.height.baseVal.value - element.value - 20;
    const ratio = 100 / (chart.height.baseVal.value / element.value);
    createBarInChart(
      currentX,
      currentY,
      barWidth,
      element.value,
      "fill:" + getElementColor(ratio) + "; stroke: black; color:black;",
      chart
    );
    currentX = currentX + barWidth * 1.1;
  });
};
You can see that it also provides a different color to the bar, by determining a "percentage" for each bar and calling a getElementColor() function. Bars will have red-ish colors if their value represents a small percentage of the SVG container height, green-ish colors if the bar value is high.
Now just need to add functions to generate the vertical scale, bar labels, legend and title elements. I'm not going to detail those here since you now should have enough information to understand those by yourself.
Have a look at the codepen to see how it's made: https://codesandbox.io/s/simple-bar-chart-generator-with-js-and-svg-txyd3?file=/src/index.js
Now, all we need to do, is create a "root function" using all our functions to create a full chart with a single line of code, and call it as many times as we want to to generate charts.
//Will Create a new chart
const newFullChart = (data, width, height, legendData) => {
const newSVG = createSvg(width, height);
generateDataBarsForChart(newSVG, data);
generateLabelsForChart(newSVG, data);
createScale(newSVG);
generateLegend(newSVG, legendData);
app.appendChild(newSVG);
};
//Creating charts!
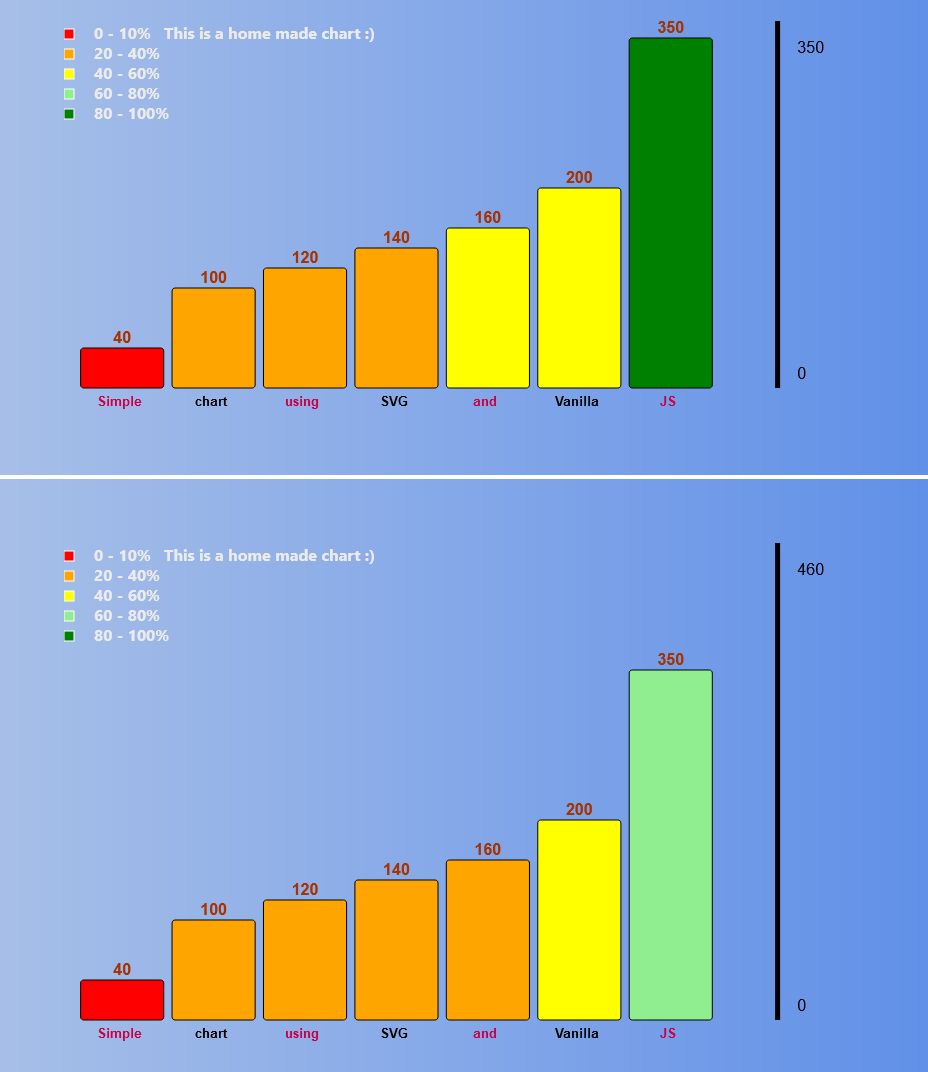
newFullChart(dataForChart, 800, getMaximumValue(dataForChart) + 40, legendData);
newFullChart(
dataForChart,
800,
getMaximumValue(dataForChart) + 150,
legendData
);
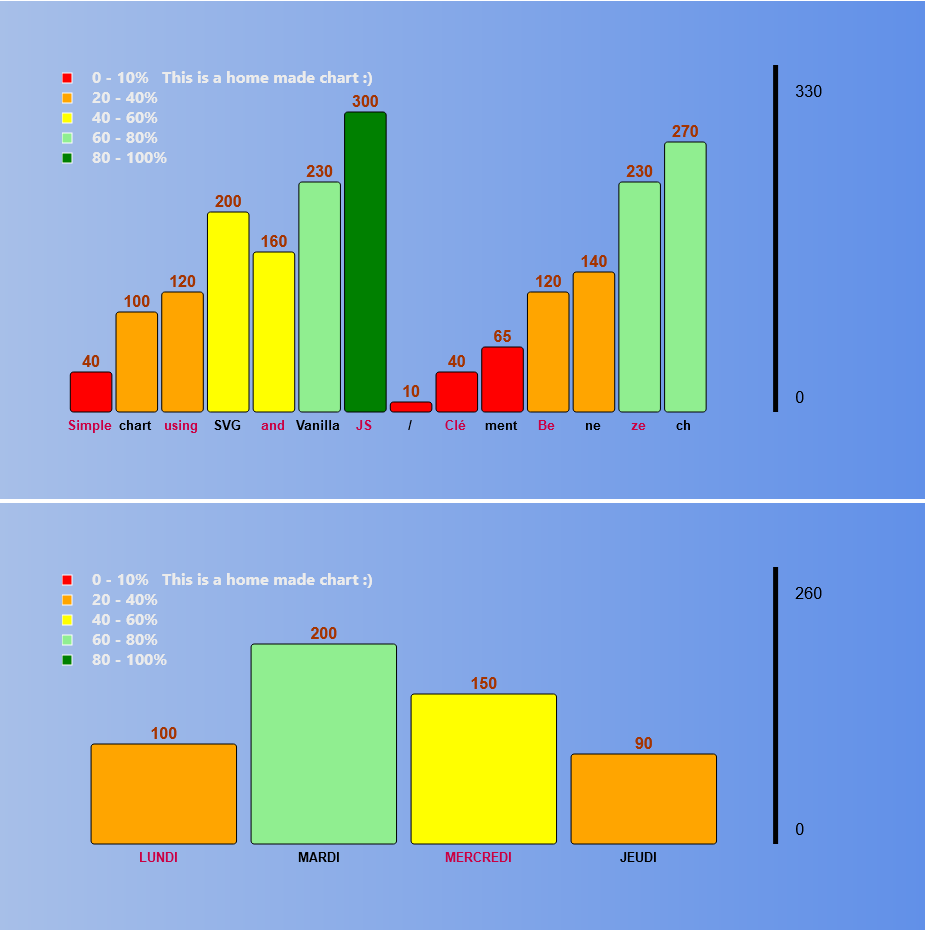
newFullChart(
dataForChart3,
800,
getMaximumValue(dataForChart3) + 70,
legendData
);
newFullChart(
dataForChart2,
800,
getMaximumValue(dataForChart2) + 100,
legendData
);
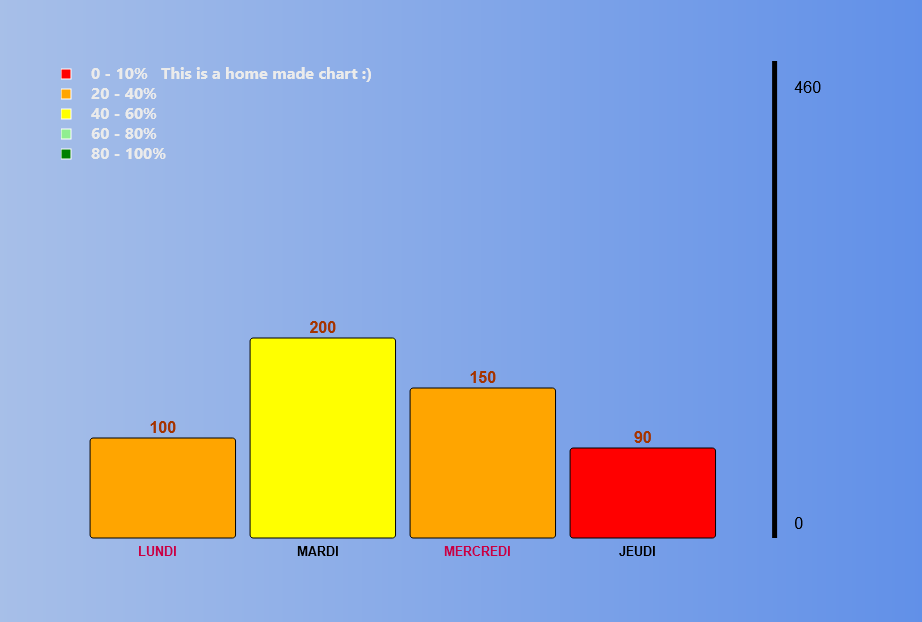
newFullChart(
dataForChart2,
800,
getMaximumValue(dataForChart2) + 300,
legendData
);
Notice we are using 3 different datasets here, and that we alter dimensions of the SVG object to see how bars behave when the top limit of the Y axis is bigger (Their coloring is altered too, because the percentage of the SVG height they fill is smaller)
As I said, I had never used SVG before, so this is only my understanding after one day playing with it. I hope it can help you understand the basics and get you started on whatever you're trying to achieve :)
That's all for today. I'll probably come back with a react based component using SVG though, so stay tune or even follow me to get notified! Thanks for reading, and feel free to provide feedback or ask questions!
THE PROJECT ON CODESANDBOX: https://codesandbox.io/s/simple-bar-chart-generator-with-js-and-svg-txyd3?file=/src/index.js:6595-7371
 ttps://media.giphy.com/media/q8C0Ljmy4F6Ss/giphy.gif

![[Back for the future] Episode 1: Setting up a simple API](/_next/image?url=https%3A%2F%2Fcdn.hashnode.com%2Fres%2Fhashnode%2Fimage%2Fupload%2Fv1641729657443%2FbF_7Peaxg.png&w=3840&q=75)

